Why is the U.S. “middle market” important?
The following was published by Livewire on 28 January 2025.
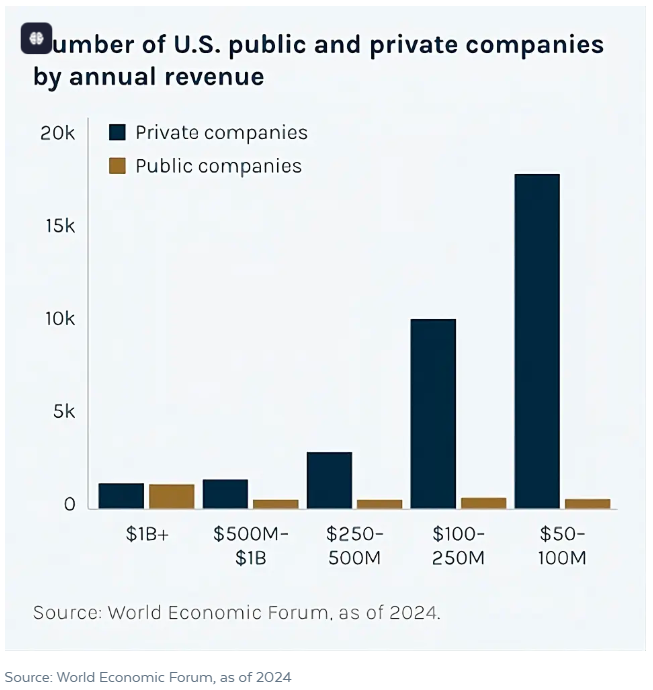
There are ~200,000 midsize U.S. companies with 100+ employees1
- Collectively, they represent ~1/3 of U.S. economic output
- Same size by output as Germany or Japan
- 99% of them are private
These midsize companies are the U.S. “middle market”2 and make up the beating heart and soul of the U.S. economy.
The vast majority of these companies are private, not publicly traded. This means that they cannot be accessed through traditional ETFs or mutual funds, but only through private equity and private credit investments.
In this piece, we highlight this important component of the U.S. economy and its relevance to the U.S. investment landscape.
The U.S. middle market in private equity
The middle market is often considered the “sweet spot” for private equity investors.
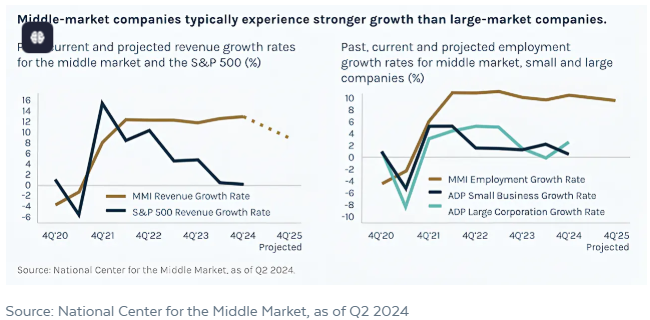
Compared to small-market private companies, middle-market GPs3 are typically large enough to have meaningful resources to invest in growth and weather economic turbulence. Their portfolio companies are typically more established than smaller companies, with diversfied customers and geographies that can make them less sensitive to economic fluctuations.
Compared to large-market private companies, middle-market companies typically have more room to grow their market share and expand their playbook across geographies.
The middle market is more fragmented than the large market. There are roughly 25x the number of privately held middle-market companies to choose from vs. privately held large-market companies4. A larger opportunity set means more potential for GPs to generate alpha.
As JP Morgan reports, purchase multiples are lower for middle-market companies vs. large-market companies (10.4x vs. 12.4x–12.9x) and leverage levels at purchase are lower (3.2x–4.6x vs. 5.9x), seeking to provide better value and helping to lower risk.5
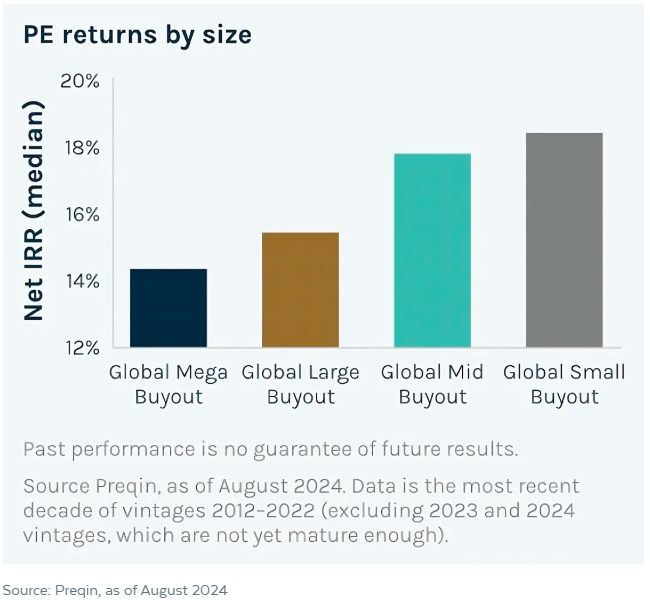
Returns for middle-market private equity have historically outperformed the large markets, with middle-market net returns broadly in line with small- market private equity, but without the low-lows that sometimes accompany small-market funds.
Finally, there may be more exit options for middle-market private equity GPs. Middle-market companies are small enough to be a target of large-market GPs and digestible to strategic acquirers, while often large enough to make an IPO into the public markets an option.
The U.S. middle market in direct lending private credit
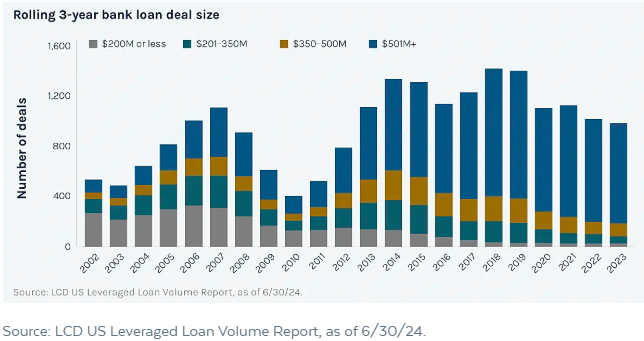
Significant bank consolidation started in the mid-1990s and led to the retrenchment of lending to small and midsize companies.
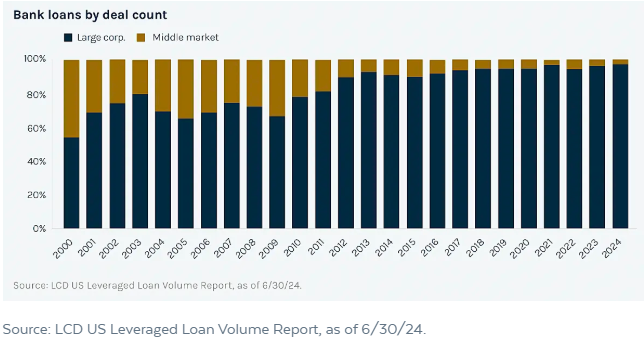
As a result, bank loan size has generally increased over the years. This has left a gap or white space for middle-market lending into which private lenders have stepped.
We believe supporting the U.S. middle market is incredibly important for the economy, and it has been the most fruitful part of the private lending market from an investment perspective.
Size differences
Different loan and company sizes have different barriers to entry. For example, to work with larger companies, a lender needs to be able to put large amounts of capital to work and compete against other large lenders, banks and public markets. To put the same amount of capital to work with smaller companies, a lender needs a larger team with depth and breadth of relationships to source deals and maintain relationships.
Many lenders prefer to lend to large companies where they can get scale. Doing large deals typically requires a smaller deal team and fewer originators doing larger dollar transactions.
On the other hand, working with smaller companies generally takes a larger team to cover more relationships. For example, to originate $1 billion in loans, a lender can do one $1 billion loan or twenty $50 million loans—essentially 20x the work to loan the same money.
This works if the lender has a large team in place, but it is tough to do when a lender is starting off and wants to originate large quantities of money. So, many direct lenders of size stick to making larger loans, even though that means competing with banks and other large lenders in a more competitive market.
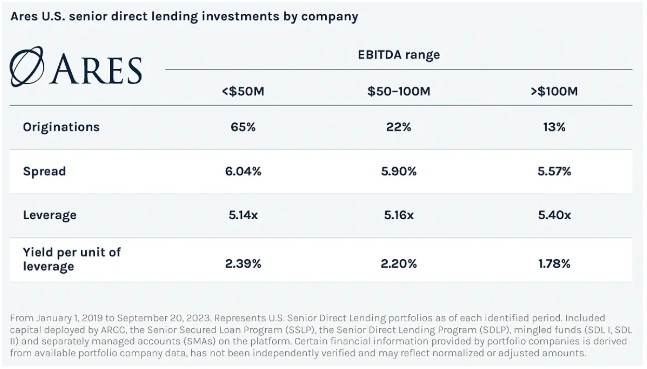
Despite the greater work required to lend to smaller companies, there is typically a payoff in the form of more favorable spreads, better incumbency and ability to scale businesses as they grow over time. We believe those private lenders with the largest and most experienced teams are best positioned to provide the strongest performance.
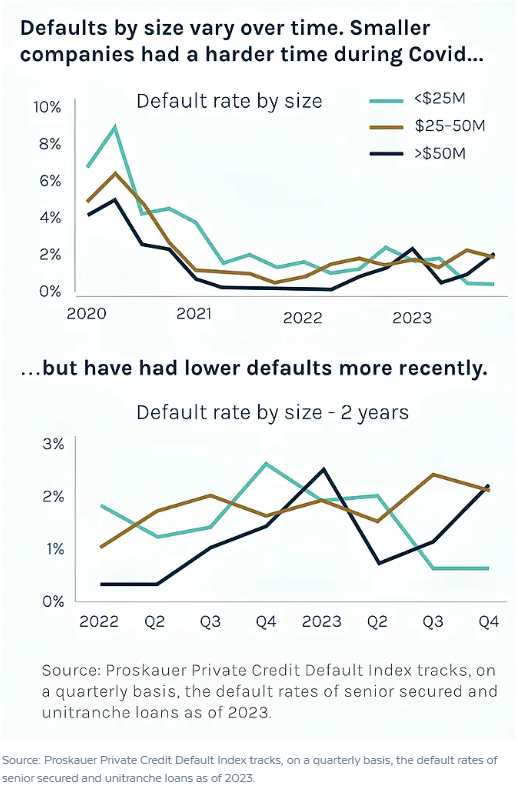
For example, in today’s environment we are seeing a ~70 bps spread between smaller EBITDA6 and larger EBITDA borrowers. (See graph below.)
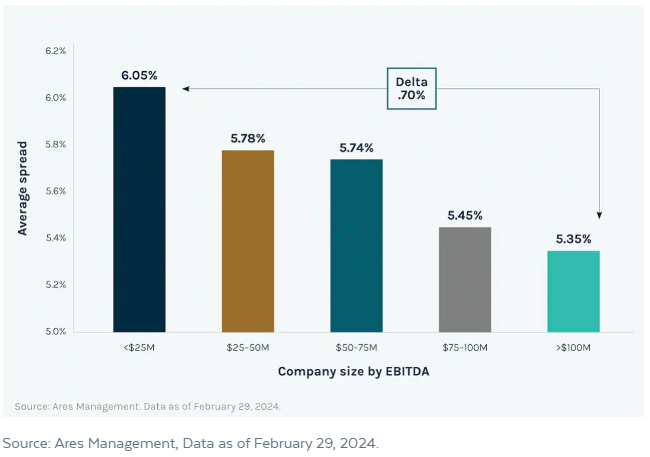
This spread has persisted through various market environments, though it can change over time, as we illustrate below.
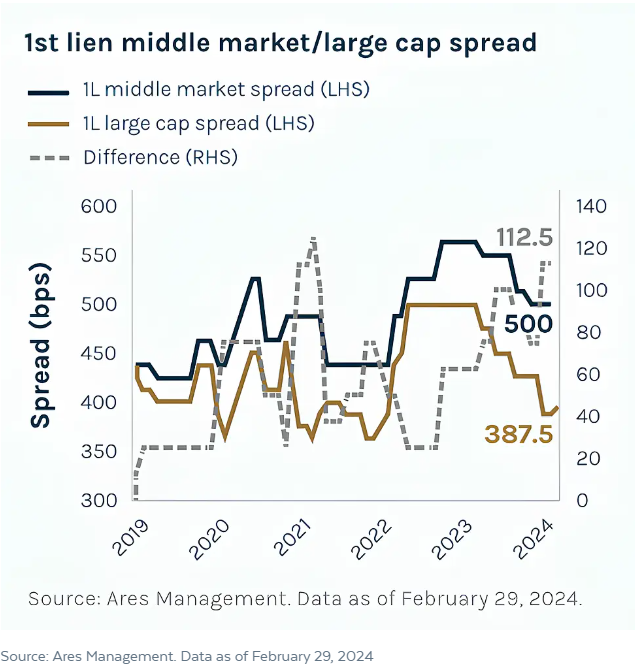
So there is a payoff for lenders that are able to work below the level of the largest companies, in what we call the middle market. Less competition can also lead to better terms for lenders. For example, higher Secured Overnight Financing Rate (SOFR) for loans to smaller borrowers can protect lenders in the case of falling interest rates.7
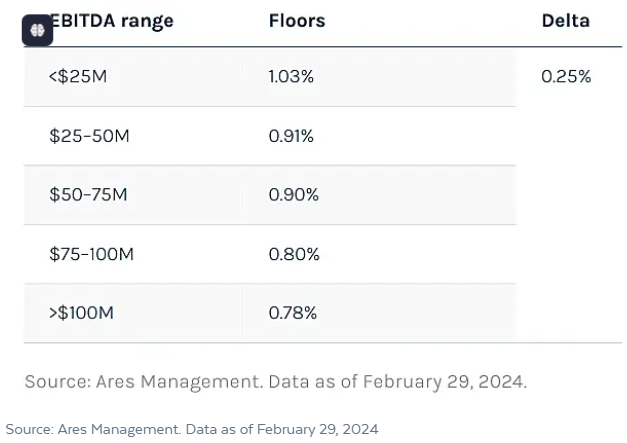
We typically also see lower leverage levels in loans to smaller borrowers, reducing the risk of the deal.
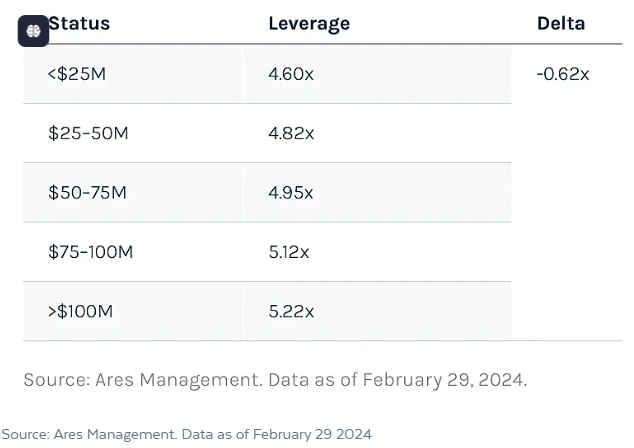
If everything is perfectly equal between a large company and small company, it is true that the larger company will tend to be less risky. But rarely are the terms the same between larger and smaller companies—typically lenders get better terms, better protections and more covenants from smaller borrowers. That said, we would still do both loans! Great companies can be found across the size spectrum, and we believe that lenders that are equally comfortable working across the smaller, middle and large markets hold an advantage.
As an illustration, below we show observed terms between different-sized borrowers over the past four years.
Further, portfolios can reduce idiosyncratic risk through greater diversification across more loans. Because of the fixed upside on a loan, differentiated returns come from minimising losses. As a result, we believe it is difficult to be “over-diversified” in credit, assuming the same underwriting standards are applied across all loans.
Conclusion
At 1/3 of U.S. economic output, the U.S. middle market is a critical part of the economy. However, with 99% of middle-market companies privately held and not within the largest name-brand private funds, they are so rarely included in investors’ portfolios.
Given the attractive growth rates and larger spreads the middle market typically experiences, we believe investors should look for ways to incorporate both U.S. middle-market equity and U.S. middle-market direct lending private credit.
- Source: Capital IQ as of January 2022. “Large market” includes companies >$100M in revenues. National Center for the Middle Market, as
of Jan 1, 2024. - “Middle market” includes companies with $10 million to $1 billion in annual revenue.
- GP = General Partner
- Source TK
- JP Morgan Private Equity Insights, “A big role for small and middle-market private equity investments” (July 2024)
- EBITDA = Earnings Before Interest, Taxes, Depreciation and Amortization
- SOFR stands for Secured Overnight Financing Rate and is used globally as the risk-free reference rate for financial contracts.
This information is for informational purposes only and is neither an offer to sell nor a solicitation to purchase any related securities. Investing in private markets investments involves a high degree of risk including, but not limited to, risk of substantial loss of principal. Direct investments in private companies and investments involve a high degree of business and financial risk that can result in substantial losses. Financial advisors must carefully consider the risks and other suitability details in determining appropriate investments for their individual clients’ portfolios. Data contained herein from third-party providers is obtained from what are considered reliable sources. However, its accuracy, completeness, or reliability cannot be guaranteed. Examples provided are for illustrative purposes only and not intended to be reflective of results an investor can expect to achieve. These materials may contain “forward-looking” information that is not purely historical in nature, and such information contained herein is based upon certain assumptions about future events or conditions and is intended only to illustrate hypothetical results under those assumptions (not all of which will be specified herein). AccessAres is the thought-leadership and educational division of Ares Wealth Management Solutions. The materials distributed by AccessAres are for informational purposes only and do not constitute investment advice or a recommendation to buy, sell or hold anysecurity, investment strategy or market sector. Ares Wealth Management Solutions is a global brand of Ares Management Corporation. In Canada, this document (this “document”) is directed only to Canadian residents that are “accredited investors” as defined under section 1.1 of National Instrument 45-106 Prospectus Exemptions and “permitted clients” as defined under section 1.1 of National Instrument 31-103 Registration Requirements, Exemptions and Ongoing Registrant Obligations. This document is not, and under no circumstance is to be construed as an offering memorandum, an advertisement or a public offering of any securities in any province or territory of Canada (each, a “Canadian Jurisdiction”). Under no circumstances is this document to be construed as an offer to sell securities or the provision of advice in relation to any securities. Any offer or sale of any securities described in this document will be made pursuant to the definitive private placement documents for the securities, which do not include this document. In addition, any offer or sale of, or advice related to, any securities described in this document will be made only by a dealer or adviser registered or relying on an exemption from registration in the applicable Canadian Jurisdiction. No Canadian securities regulatory authority has reviewed or in any way passed upon the information contained in this document or the merits of any securities described in this document, and any representation to the contrary is an offence. © 2024 Ares Management Corporation. REF: AM-03697
Related Insights
Inside Network: Interview with Teiki Benveniste at Alternatives Symposium 2024

The private investment idea this fund manager is targeting for double-digit returns